Surface Interpolation -
Interactive presentation on multi dimensional non parametric regression
2002-Feb-06
version 0.2
Stefan Dirnstorfer
|
What is this about?
Multi dimensional data sets appear in many areas of financial
engineering. They can be modelled mathematically with higher
dimensional functions. This page demonstrates the basic concept behind
an implementation that handles these functions and interpolates it from
given points or known market prices.
What is multi dimensional regression
- Approximate scattered point clouds
- Smoothing outliers
Applications
- Volatility surfaces on equity
- 3D surfaces of swaption volatilities (strike, maturity of option, maturity of underlying)
- Spread curves with rating and maturity
Concept of basis function
In order to express mathematical functions numerically it is a
widely adopted concept to store them with a set of basis
functions. Those can added and approximate arbitrary functions by
linear combination. The numerical algorithm stores and manipulates the
linear coefficients.
Hat functions
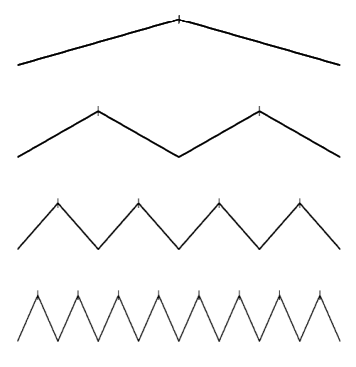
A simple set of basis functions is plotted below. These piecewise
linear functions are devided into different levels of resolution. In
the first row the coursest function spans over the entire domain,
while functions on the finest level only have small support.

Hat functions with different levels of resolution
Interpolation example
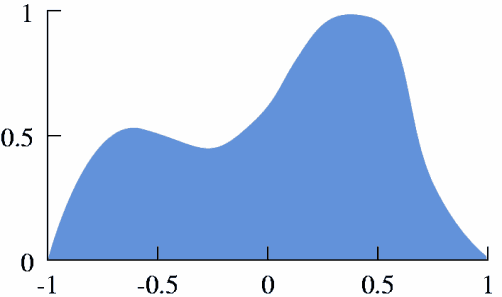
According to the required accuracy and the available computational
resources a function can be approximated by combining basis functions
up to certain level of resolution. You can cycle through these levels
by clicking on the picture below. In every new level finer basis
functions reveal new details of the original mountain.

Click to cycle through interpolation steps.
Multidimensional basisfunctions
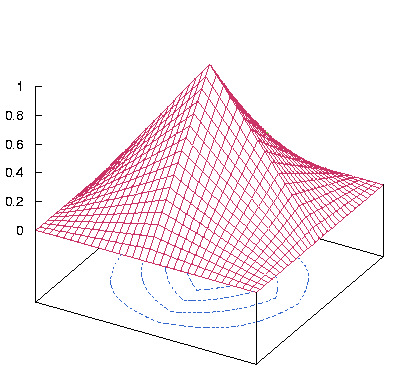
The tensor product allows the construction of multi dimensional hat functions.

The plot below visualizes tensor product functions generated by a
combination of unidirectional hat functions. Each direction x and y is
associated with one resolution level. Combinations of levels yields
two dimensional basisfunctions with rectangular support.

Click to cycle through basis functions.
Minimization
The minimization problem is described informally by the goodness of
interpolation and a measure for the resulting functions smoothness.
Minimize inerpolation error + roughness
Mathematicall this can be written by a regression forumla with a
residual measuring roughness. Each point has a weight
wi. Low weights yield the interpolation surface to be
smooth rather that fitting the points exactly. High weights let the
surface be close to that point.

An appropriate rougness messure is expressed by the norm of the
functions laplace. This yields an algorithms favor for linear
functions.


