Phil -
Financial Information Layer
2002-Mar-26Version 1.0
Nagler & Company

Phil -Financial Information Layer2002-Mar-26Version 1.0 Nagler & Company |  |
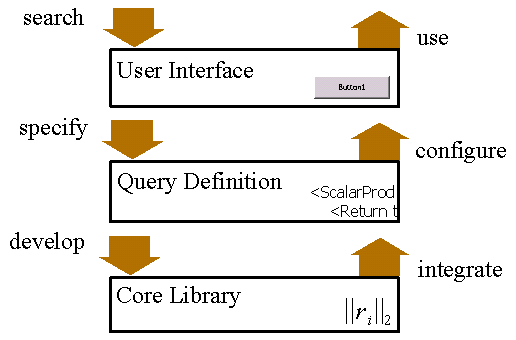
This concept covers the development of flexible user interfaces and the rapid integration of algorithms and external software. Based on common Internet standards user interfaces can scale from simple forms up to complex interaction features which create structured XML documents. Thereby users can be enabled to configure simple queries or even define complete programs. The generated queries are stored on a central database and made searchable by keywords. A set of common and stable operations can be stored or be developed cooperatively here. These documents can be sent to a server where they are interpreted by a computation engine. The components of the query are mapped to certain information on databases or to other modules which are made available by any integrated software package. The development of custom made packages is also considerable simplified by a set of design patterns optimized for common financial problems.
Phil features:

| storage of reusable modules |

| easy combination of various modules |

| convenient access to functionality of installed software |

| multiuser platform and developing environment |

| no installation effort at the users desk |

| easy enlargement of functional spectrum |

On the server side there is an XML database which stores Finance Phil queries and appropriate forms encoded in PhilML and XForms respectively. PhilML is a dialect of XML describing a Finance Phil queries. XForms is the W3C certified standard for user interfaces allowing dynamic generation and manipulation of XML documents. Together these can be displayed in an HTML browser as a form with default values and a set of interaction features allowing different degrees of flexibility. The computation engine parses the PhilML document and instantiates appropriate Java classes. The development of additional classes is made straightforward by code wizards and predefined design patterns. Programmers fill in algorithms to perform specific computations or to pass the request to either one of the connected data sources or any of the available computational packages. The PhilML interpreter cares for the combination and configuration of individual classes. Multi step server interactions can be implemented by embedding XForms into a resulting web page. This connects the result to other queries a user might perform on the result.

| User Interface The first level consists of a form database with automated search facilities. New entries are made by mapping query components to their graphical representation or by assigning any of the XForms interaction features. User interfaces are maintained by web designers with close insight into the users environment. They have to explain the query features in terms of the users vocabulary, write help texts and apply corporate design. |

| Query Definition When a request for a new query is specified the second level can configure existing functionality to solve the problem. It is maintained by people skilled in the area of market data and with good knowledge about the companies data sources and their peculiar properties. Hence they are capable of providing qualified configuration of queries. Here a set of reference modules is constructed to provide suitable and tested data for usage in stable environments. |

| Core Library The third level develops the core library of computation modules, which are integrated into the query definition. Mathematical and statistical methods are developed by mathematicians with good knowledge of programming languages and various computational packages with predefined algorithms. Good understanding of financial models and database interfaces belong to the virtues of this section. |
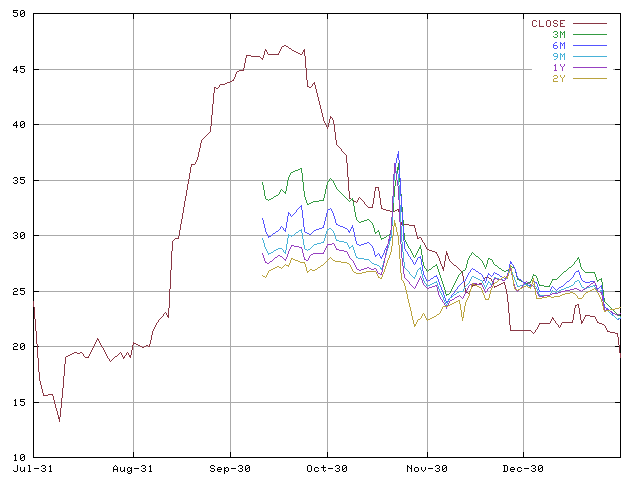
A volatility surface represents the expectations for future stock price movements into a certain regions. It is extracted from market prices of exchange traded put and call options. Every trade has the coordinates time, strike and volatility. The cloud of trade points is approximated by a non parametric regression surface that smoothes outliers and interpolates the surface in areas where no trades were available.

Another view at the implied volatilities is demonstrated by the following plot. The expected volatilies with different times to maturity are plotted against the realized volatility. The plot shows regions of increased volatility starting at September, 11th and lasting until the end of November. In mid of October when the implied volatility collection starts the large difference between short ranged and long ranged expectations demonstrate the markets belief into falling volatilities. In late November a massive peak in the the timeseries is most probably an error in either the raw data feed or in one of the numerical implementations.
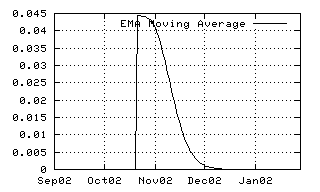
Due to the random character of market prices, smoothing timeseries data is commonly part of the analysis. This technique is known as moving average and is often plotted against the original chart. Statistical parameters like volatilities and correlations are essentially moving averages over logarithmic returns or products of returns. There are different methods to weigh past values. Instead of just averaging a fixed number of recent values, it is generally more advisable to assign different weights according to the values age. The plots below demonstrate this feature and show how easily this concept is expressed with the PhilML query language.

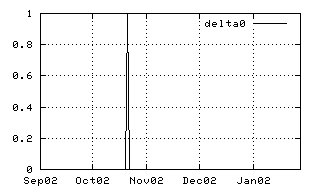
| The first example shows the definition of a most simple generic time series with one single peak at the specified position. Time series can also be retrieved from the database with queries containing the connection parameters. |

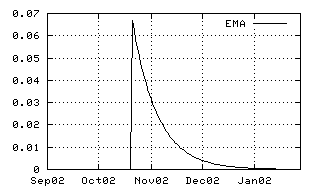
| The second example shows the impact of an exponential moving average operator. It is constructed just by placing the <Ema> and the <Decay> tag around the original time series. All elements in the PhilML Code can be referenced by their id or by an XPath expression. The picture shows how the peak fades into later values, i.e. into abscissae with higher time stamps. |

| The third picture visualizes a more sophisticated moving average, defined by its decay and its window form. This kernel offers additional control over its width and its window form. |
| Output | XML Query |
|---|---|
|
<DeltaFunction id="delta"> <Length>5m</Length> <Position>2001-10-25</Position> </DeltaFunction> |
|
<Ema> <Decay>15</Decay> <Include ref="delta"/> </Ema> |
|
<MovingAverage> <Decay>15</Decay> <Window>0.7</Window> <Include ref="delta"/> </MovingAverage> |